Performance against our Financial Framework
Reporting on the financial performance of the Qantas Group.
The Qantas Group aims to achieve top quartile Total Shareholder Returns (TSR) relative to the ASX100 and global airline peers. In line with this objective and the Group’s Financial Framework, we report on a number of metrics over time. Where appropriate, the Group reports on both the statutory and underlying metrics. Underlying Profit Before Tax is a non-statutory measure and is the primary reporting measure used by the Chief Operating Decision-Making bodies, being the Chief Executive Officer, Group Leadership Team, and the Board of Directors, for the purpose of assessing the performance of the Qantas Group. ESG metrics have also been incorporated into the Financial Framework. The COVID-19 pandemic has had an extensive impact on the Qantas Group which is reflected in our financial performance.
Financial framework aligned with shareholder objectives
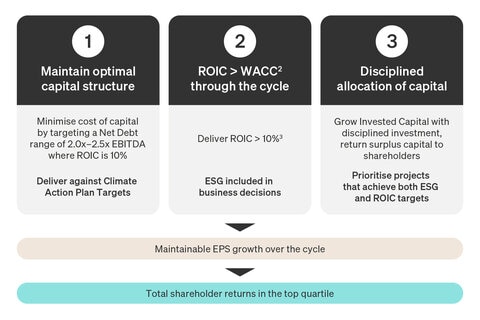
Qantas' Financial Framework aligns our objectives with those of our shareholders with the aim of achieving top-quartile shareholder returns by targeting maintainable Earnings Per Share (EPS) growth over the cycle with industry-leading ESG credentials. The Financial Framework is built on three clear priorities and associated long-term targets:

- Maintaining an optimal capital structure: Minimise the cost of capital by targeting a Net Debt range of 2.0-2.5x EBITDA where ROIC is 10 per cent, and deliver against Climate Action Plan targets.
- ROIC > WACC through the cycle: Deliver ROIC greater than 10 per cent, ESG included in business decisions.
- Disciplined allocation of capital: Grow Invested Capital with disciplined investment and return surplus capital to shareholders, and prioritise projects that achieve both ESG and ROIC targets.
Maintainable EPS growth over the cycle.
Total shareholder returns in the top quartile
Net debt
As at 30 June 2024, net debt under the Financial Framework was $4.1 billion, which is in the lower half of the Group’s target range of $3.9 billion to $4.9 billion.

Net debt includes on balance sheet debt and aircraft operating lease liabilities under the Group’s Financial Framework.
Group Return on Invested Capital
Return on Invested Capital (ROIC) is the primary financial return measure for the Group. Our target is to achieve ROIC greater than our Weighted Average Cost of Capital (WACC) through the cycle. Our threshold of 10 per cent ROIC allows ROIC to be greater than pre-tax WACC through the cycle. As a result of the impact of COVID-19, ROIC did not meet the threshold of 10 per cent in FY20, FY21 and FY22. However, since our turnaround in FY23 the Group had been consistently delivering ROIC well in excess of this threshold. In FY24, on a 12-month rolling basis, ROIC declined 46 percentage points from 103.6 per cent as at 30 June 2023 to 57.9 per cent as at 30 June 2024. The Group ROIC is expected to moderate in future periods as Invested Capital rebuilds, however structural changes in earnings, and working capital benefits are expected to deliver Group ROIC in excess of pre-COVID levels.

Calculated as ROIC EBIT for the 12 months ended for the reporting period, divided by 12 months average Invested Capital.
Net free cash flow
Targeting an optimal capital structure and measuring ROIC performance provides a platform for making disciplined decisions regarding shareholder distributions, reinvestment in our business and net debt reduction. We will invest prudently in capital expenditure from operating cash flow to increase future returns, with surplus capital returned to shareholders. Net free cash flow was $554m for financial year 2023/24. The decrease from financial year 2022/23 in operating cash inflows were primarily due to the rebuild Revenue Received in Advance impacting the prior year and a reduction in earnings and one-off impacts in the current period from realisation of provisions from the buyout of operating leases. In FY24, investing cash outflows also increased, with net capital expenditure of $3,148m, which included 16 aircraft deliveries, pre-delivery payments, acquisition costs of TripADeal and the balance primarily directed to capitalised maintenance.

Net Free Cash Flow is net cash from operating activities less net cash used in investing activities (excluding aircraft operating lease refinancing).
Shareholder returns
Since FY15 and prior to the COVID-19 pandemic the Group had strong history of generating surplus capital and returning this to shareholders. To preserve balance sheet strength, under its Financial Framework, there were no shareholder distributions during COVID-19. In FY24 $869m in share buy-backs were completed during the financial year. The remaining $31 million is expected to be completed in the first half of financial year 2024/25.

Earnings per share
The Group tracks Earnings Per Share (EPS) on a statutory basis. Earnings per share for FY22 was less than zero due to the impact of the COVID-19 pandemic. Statutory Earnings Per Share (EPS) was 75.9 cents per share for financial year 2023/24. The decrease from financial year 2022/23 was driven by a decrease in Statutory Profit After Tax, partially offset with the EPS accretion from capital distributed via prior on-market share buy-backs.

Underlying Earnings Per Share calculated as Underlying Profit Before Tax less tax benefit/expense (based on the Group's effective tax rate for the period) divided by weighted average number of shares during the year.
See further details on the Group’s history of capital management
Notes
Refer to the Review of Operations section in the Qantas Annual Report 2024 for definitions and explanations of non–statutory measures. Unless otherwise stated, amounts are reported on an underlying basis.
- Disclaimer: Environmental, Social and Governance
- Disclaimer: Weighted Average Cost of Capital, calculated on a pre-tax basis
- Disclaimer: 10 per cent ROIC allows ROIC to be greater than pre-tax WACC through the cycle

